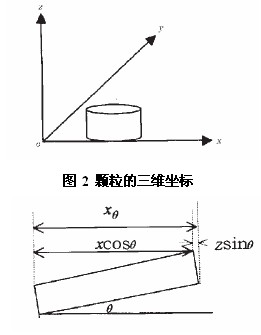
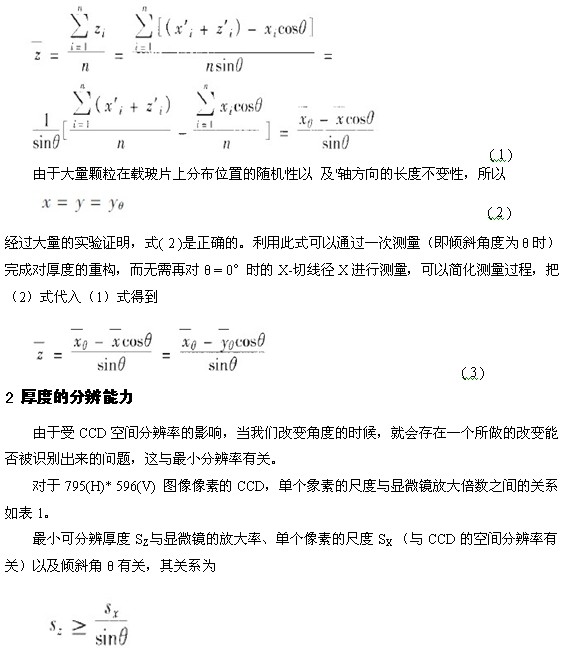
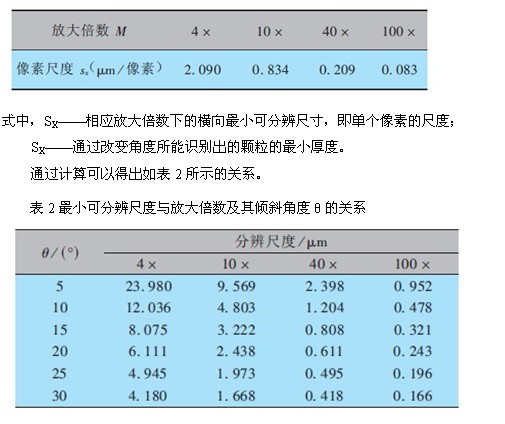
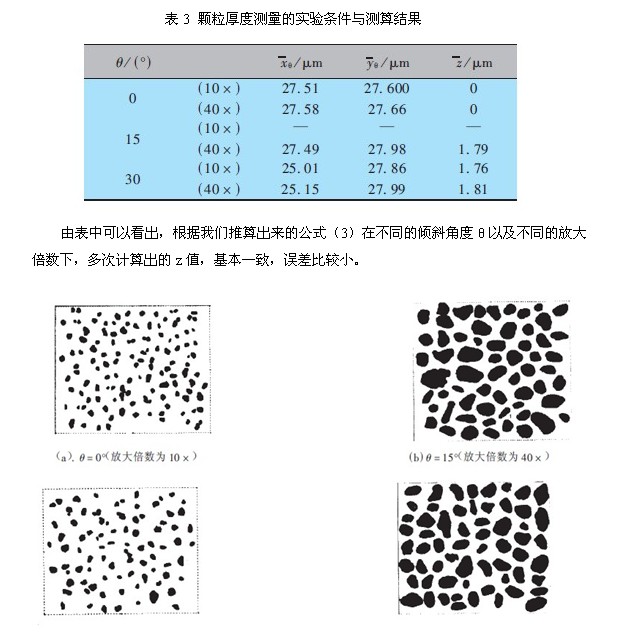
Dou Yanling, Ren Zhongjing, Jiang Haiying ( Institute of Particle Testing, Jinan University, Jinan, Shandong 250022) Abstract : Different from the traditional orthographic projection microscopic image analysis method, this paper applies the oblique projection method to transform the angle of the particle group and derives the calculation formula of the particle group thickness based on the obtained information of the particle group under the optical microscope. The relationship between thickness resolving power and tilt angle and magnification is demonstrated. The application example proves the feasibility of the method. Keywords: oblique projection; microscopic image analysis; 3D reconstructed; stereology In Figure classification codes: TH74 literature code: A Article ID: 1008--554 (2004) DOUYan-Ung , RENZhong-jing , JIANGHai-ying ( Abstract: The token information of particle group under light microscope is obtained based on slant projection The calculating formula of particle group thickness is deduced, then the relation of thickness resolving power, slant angle and magnification is discussed The feasibility of this method is proved.. Through the example. Key  Keywords : oblique projection ; micro-image analysis; three-dimensional reconstruction; stereology In order to control material quality and its physical and chemical properties, three-dimensional features of particles need to be described in many fields of materials science and engineering. Therefore, experimental observation and scientific quantitative characterization of three-dimensional ( 3D ) microstructures are the core of materials science. One of the problems [1] is also the focus and difficulty in the field of materials science and engineering [ 2 ] . A variety of measurement methods and measuring instruments have been developed. Among them, optical microscopy is an important tool for studying micro-nano materials, and it shows the microscopic morphology of materials in the form of images. Similarly, microscopy is one of the most basic and practical methods of measurement and is often used to verify and even calibrate other measurement methods. Image analysis technology is a technique or method for extracting specific data from two-dimensional images [ 3 ] . The development and application of microscopic image analysis technology has made the detection of microscopic morphology span from qualitative to quantitative representation . However, the existing analysis technology only provides two-dimensional information of micro-nano materials, and the three-dimensional shape of the microstructure is still not directly experimentally observed. Therefore, how to establish a microscopic image analysis method from two-dimensional to three-dimensional will be the material. The urgent need for chemical research and production. The shape of the particles affects many properties of the particles. The mechanical properties such as fluidity , compressibility and filling of the powder and its packaging, transportation, storage and coating effects are closely related to the shape of the particles [ 4 ] . The difference in particle shape determines its different uses. Flaky particles are widely used in paints and coatings, and their thickness has an important influence on the surface coating effect. In addition, the size of the flaky particles can be estimated in two-dimensional micrographs, but it is impossible to know their thickness [5] , but the actual engineering problem requires three-dimensional information that better reflects the shape characteristics of the particles, in view of three-dimensional measurement in particle shape analysis. The significance of this is measured in the thickness of the flaky particles. Based on the imaging principle of the microscope method, a planar projection image of the particles is observed. When the sample particles are spherical, the method can directly measure the particle size from the projected image. However, for most irregular sample particles, traditional microscopy can only give the two-dimensional scale ( length and width) of the particles , and it is difficult to make a valuable judgment on another dimension (height ) [ 6 ] . In stereology , spatial shape reconstruction can be realized according to the two-dimensional spatial projection of objects in multiple directions [7] . Based on this, In this paper, we try to change the angle of the sample under the optical microscope to obtain more characterization information of the particles, and then reproduce the three-dimensional structure of the particles. The principle of microscopic image analysis is based on the orthographic projection method. For cylindrical particles, the orthographic projection is a circle or rectangle, as shown in Figure 1 . When we rotate the lens by an angle, that is, tilt the projection direction by an angle , and then observe the particles, we will observe different scale information. Based on this principle, we reconstruct the thickness of the particles based on the observed particle information. The following scale based on the quantitative relationship between the particle projected two-dimensional image with the angle of rotation, the derivation of formula grain thickness. We first establish a three-dimensional coordinate system, as shown in Figure 2 . When observing the particles along the Z- axis (ie, the projection direction is perpendicular to the XOY plane), we observe the lengths in the X and Y directions, and we cannot observe the Z direction. When we compare the slides on which the particles are placed stage inclined at an angle θ, which the two-dimensional plan view as shown in FIG. Regardless of the change in the angle θ , the direction of the Y- axis in the coordinate system based on the particle is always perpendicular to the projection direction, so the length of the observed X- axis direction does not change, and the scales in the X- axis and Z- axis directions occur. Change, you can get Where x θ and x are the tilt angles of the slides θ ( θ > Particle dimension 0 °) direction of the microscope and measured in the case of θ = 0 °. When we measure particles, they are generally a group of particles composed of a large number of particles, so measuring the overall characteristics of the particle group is more practical and valuable than measuring the characteristics of individual particles, and it is difficult for individual particles in the measurement process. Positioning, therefore, we analyze the measurement of the three-dimensional scale of particles based on particle groups. For a large number of particles randomly distributed on the slide, we can find the average of the three-dimensional scale Table 1 Relationship between the scale S X of a single pixel and the microscope magnification M In actual operation, you can first select the appropriate magnification and the angle of the desired tilt according to the estimated thickness of the particles. For example , if the thickness of the particles is estimated to be about 1 μm , the corresponding conditions can be selected from the data in the above table, such as When the magnification is 40 × , the inclination angle is 15 to 30 ° ; or when the magnification is 100 × , the inclination angle is 5 to 30 ° . 3 test methods In this paper, a large number of experiments have been carried out on the measurement of particle thickness under optical microscope. The following is an example of a particle thickness reconstruction calculation. We use flake graphite experiments equipment for optical microscope, CCD camera and image analysis software Imganaly (this software specially developed for the test). 3. 1 working principle of the instrument The particle information observed by the microscope is transmitted to the computer through the CCD camera, and the particle information is digitized into image elements or pixels, which are processed by the Imganaly image analysis software according to the obtained image gray scale, and the geometric information of the image such as size and quantity is processed. Quantitative analysis and calculation of morphology and morphology. Experimental steps 3.2 Sample Preparation: first preparing a slide more uniform dispersion of the representative sample. A representative sample of the graphite sample is placed in a test tube, an alcohol dispersing agent is added, and the mixture is uniformly dispersed, and the mixed liquid sample is dropped on the microscope slide, and after the alcohol is volatilized, it is available for detection. Since the angle θ at which the angle of the inclined sample is inclined to the projection direction is uniform, we have made the transmitted sample form a different oblique projection image by tilting the sample. Based on the estimated particle thickness, select the appropriate magnification and the angle of the desired tilt. Obtaining an image: CCD intake oblique image field of view of a sample for particle image acquisition by the image analysis software Imganaly, stored and displayed on the computer display. Image processing: The key to image processing is binarization, that is, the selection of the gray threshold. After selecting the appropriate threshold, the image is smoothed and edited to make it a binary image. Image analysis: After binarizing the image, a series of image analysis can be performed. The scale and density are calibrated according to the selected magnification. The obtained database is saved after particle analysis, and the X - tangential diameter and Y of the particle are obtained. - cutting diameter, Martin diameter and other basic parameters. Under different experimental conditions, namely different magnifications and tilt angles θ , we can observe different particle images. The images of some particles after several series of image processing such as binarization are shown in Fig. 4 . After software analysis, the X - tangential diameter and Y of each particle can be obtained . - The value of the tangential diameter , the value of x and y at the corresponding angle θ is calculated from a large number of particle data values , and the value of z can be calculated by substituting equation ( 3 ) according to the known tilt angle value, and the specific measurement result is as follows Table 3 shows. 4 Discussion and conclusion This paper proposes a new method for measuring the thickness of the tabular grains, the measurement principle is given, the relevant derived equations, the thickness of the resolving power of the analysis of the tilt angle, the relationship between the amplification factor, and this proved by experiments The method has certain feasibility. When we use software for binarization, the particle size will be different due to the difference in brightness of the captured images and the selected threshold. During the experiment, taking the strength of the light transmittance remains the same conditions, and performing binarization when a certain threshold selection method and the like, to minimize the error of the measurements of these factors caused. In addition, due to the depth of field of the microscope, the particles of different thicknesses have different degrees of clarity under the same conditions of focusing, so it is necessary to select the corresponding thickness according to the thickness of the particles. Magnification so that the top and bottom surfaces of the same particle are in the same It can display clearness under focal length and reduce measurement error. In addition, our three-dimensional reconstruction is limited to the measurement of particle thickness, which is a relatively simple three-dimensional reconstruction and is limited to the measurement of the thickness of the flake particles. Experimental results show that the reconstructed three-dimensional image of an optical microscope can be effectively reproduced calculated thickness of the particle, the method will only be observed by the microscope, two-dimensional information of particles becomes able to obtain information about the third dimension - the thickness, having a major breakthrough action and promotes The effect makes the improvement of the microscope feasible and important practical value. references: [1] Liu Guoquan . Research on 3D Microstructure of Materials : Progress and Prospects [J]. CT Theory and Applied Research , 2000 , 9 : 148 - 153. [2] Liu Guoquan, Zhang Hey, Qin Xiangge, and so on . Three-dimensional observation of material microstructure and image-based model study [J]. Chinese Stereology and Image Analysis, 2001 , 6(1) : 46 -49. [3] Liu Guoquan, Song Xiaoyan, Chen Yulai, et al . A new type of three-dimensional grain structure simulation model for stereology [J]. Chinese Stereology and Image Analysis, 1998 , 3(3) : 129 - 133. [4] Zhang Youlin , Xia Jiahua , Li Guohua , et al . Shape and fractal dimension of powder particles [J] Wuhan University of Technology, 1996, 18 (4): 53-56. [5] Ren Zhongjing, Jia Huiyou . Study on the distribution of shape parameters of graphite micropowder [J]. China Powder Technology, 1999 , 5(1) : 19-21. [6] Wang Naining . Optical measurement technology and application of particle size [M]. Beijing: Atomic Energy Press , 2000. 29. [7] Yu Yongning, Liu Guoquan . Stereology [M]. Beijing: Metallurgical Industry Press , 1989.2.
Tof(Time-of-flight), is JRT new product, which is a single-point LiDAR sensor. With a micro size of 46x17x7mm, customers can widely use in many Laser Measurement Solutions. The lidar distance sensor can measure 12m short-range. It's great for Unmanned Aerial Systems.Contact Us Now for data sheet.
ToF Sensor,Time of Flight Sensor,LiDAR Distance Sensor,ToF Distance Sensor Chengdu JRT Meter Technology Co., Ltd , https://www.infrareddistancesensor.com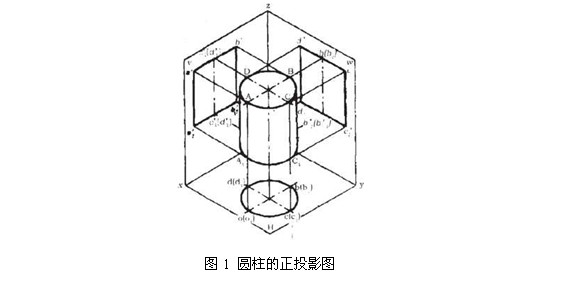

Product Name
Tof LiDAR Sensor
Model Number
IT02S-65-A/IT02S-65-B/IT03M-650
Measuring Range (without Reflection)
0.1-12m/0.1-10m/0.1-15m(90% reflectivity)
Place of Origin
China
Accuracy
2cm~4cm/5cm
Blind Area
10cm
Resolution
1cm
Measuring Unit
centimetre
Laser Class
Class II, red
Laser Type
650nm, <1mW
Communication Interface
UART, 115200bps(default)
Size
46*17*7mm/50*26*13mm
Weight
About 4g/10g
Voltage
2.7V~+3.6V
Electrical Level
TTL/CMOS
High Frequency
100hz
Operating Temperature
0-40 ℃ (32-104 ℉ )
Storage Temperature
-25~60 ℃ (-13~140 ℉)